
What is database activity monitoring? A practical guide
What is database activity monitoring? Learn what DAM records, how the four collection methods compare, DAM vs SIEM vs DLP, and a checklist for rollout.
Key takeaways
- Database activity monitoring (DAM) records who did what inside a database, scores it for risk and keeps the evidence outside the database it describes.
- DAM tools collect activity in one of four ways: reading native audit trails, copying network traffic, running a host agent, or sitting inline as a proxy.
- Only an inline proxy can block a statement before it runs; out-of-band collection observes and alerts without touching the transaction path.
- DAM complements SIEM and DLP: DAM understands database identities and SQL, SIEM correlates across the estate, DLP watches data leaving through other channels.
- A DAM rollout starts with audit configuration and a sensitive-data inventory, not with alert rules.
What is database activity monitoring? It is the practice of recording every security-relevant action taken inside your databases (sign-ins, queries, schema changes, privilege grants), analysing those actions for risk, and keeping the evidence somewhere the people being monitored cannot alter. This guide is for security leaders, DBAs and engineers who need to decide how to monitor Oracle, PostgreSQL, SQL Server or MySQL estates. It covers what DAM records, the four ways tools collect activity and their trade-offs, how DAM differs from SIEM and DLP, what auditors look for, and a checklist for a first rollout.
Database activity monitoring (DAM) is a security control that captures database sign-ins, queries, schema changes and privilege changes, attributes each one to an identity, analyses it against rules or behaviour baselines, and stores the record independently of the monitored database for investigation and audit.
What is database activity monitoring, and what does it record?
A DAM tool answers four questions about every event: who acted, from where, what they did and whether it worked. In practice that means a database user and client address, a timestamp, the statement or action type, the objects touched and a return code. Our DAM glossary entry covers the term itself; the categories below are what a useful deployment captures.
| Event category | Examples | Why it matters |
|---|---|---|
| Authentication | Successful and failed logons, logoffs | Brute-force attempts and use of shared or default accounts |
| Privilege changes | GRANT, REVOKE, CREATE USER, role membership changes | Escalation by insiders or by an attacker who has a foothold |
| Schema changes (DDL) | CREATE, ALTER, DROP, TRUNCATE | Destructive or unapproved changes to production |
| Data access (DML) | SELECT, INSERT, UPDATE, DELETE on sensitive tables | Bulk reads of personal or financial data, manual ledger edits |
| Administrative actions | Configuration changes, audit policy changes | Attempts to switch monitoring off |
What a tool can record depends on how it collects. A tool that reads native audit trails sees what each database’s audit is configured to record, so audit policy design is part of the project. A tool that copies network traffic sees statements on the wire but may miss local connections.
How does database activity monitoring work? Four collection architectures
There are four common ways to get activity out of a database. None is free of trade-offs, and several products support more than one.
1. Reading native audit trails
Every major engine can audit itself. Oracle’s unified auditing writes records “in a uniform format” to the UNIFIED_AUDIT_TRAIL view in the AUDSYS schema, and the underlying table allows only INSERT activity. PostgreSQL relies on the pgAudit extension, which writes session and object audit entries to the standard logging facility in classes such as READ, WRITE, ROLE and DDL. SQL Server Audit uses server and database audit specifications and writes to a file or a Windows event log.
A DAM collector then reads those trails with a database account and ships the records to its own store. The trade-offs: nothing sits in the transaction path and no software goes on the database host, but you only see what audit is configured to capture, and audit itself has a cost. The pgAudit README warns it can generate “an enormous volume of logging” and that audit logging may noticeably affect latency, so audit scope needs tuning.
2. Copying network traffic (out-of-band)
A sensor receives a copy of client traffic from a span port or network tap and parses the SQL protocol. Oracle describes this mode for its Database Firewall: traffic can be copied by “spanning ports, network taps, and using packet replicators”, and in this mode the firewall can monitor and alert on SQL traffic, but cannot block. It adds no software to the database, but encrypted sessions and connections that never cross the network, such as a DBA on the server itself, need extra handling.
3. Host agents
A small agent on the database server watches traffic between clients and the database and forwards it to a central collector. IBM describes its Guardium S-TAP as a lightweight software agent installed on database servers that forwards activity to the Guardium collector. Agents can see local connections that network sensors miss, at the price of software to install, patch and test on every database host.
4. Inline proxies
Clients connect to a proxy, which connects to the database. Oracle documents that in proxy mode its Database Firewall “can both monitor and block SQL”. This is the only architecture that can stop a statement before it executes. The cost is an extra component in every connection path, which needs high availability planning, and the database should refuse connections that bypass the proxy.
| Architecture | Software on DB host | In transaction path | Can block | Main gap to plan for |
|---|---|---|---|---|
| Native audit trails | No | No | No | Coverage equals audit configuration |
| Network copy | No | No | No | Local and encrypted sessions |
| Host agent | Yes | No (observes) | Varies by product | Agent lifecycle on every host |
| Inline proxy | No | Yes | Yes | Availability and bypass routes |
Why native audit logs alone are not enough
Native audit generates the raw records, but on its own it leaves three gaps. Each engine has its own format and location, so a team running several engines has no single view. A log does not raise an alarm, and nobody reads millions of lines in real time. And the log lives with the people it describes: Microsoft’s documentation warns that principals in the sysadmin role can tamper with any audit component and recommends reporting from a separate instance.
DAM closes those gaps by collecting from every engine into one normalised store, applying rules and baselines as events arrive, and keeping the copy under separate access control.
DAM vs SIEM vs DLP vs PAM
These controls overlap at the edges but answer different questions, which is why most programmes run more than one.
| Control | Main question | Strength | Typical blind spot |
|---|---|---|---|
| DAM | Who did what inside the database? | Understands SQL, database identities and sensitive columns | Activity outside databases |
| SIEM | What is happening across the estate? | Correlates many sources, long retention | Needs parsed, enriched database events to be useful |
| DLP | Is sensitive data leaving through email, web or endpoints? | Content inspection on exit channels | Queries run inside the database |
| PAM | Who may connect with privileged rights, and when? | Controls and records privileged sessions | What a query did once connected |
DAM usually feeds the SIEM rather than replacing it, sending scored alerts instead of raw audit lines. Privileged access management controls the door; DAM records what happens in the room.
Database activity monitoring for compliance
Auditors rarely name DAM, but several frameworks require what it produces. HIPAA’s audit controls standard requires mechanisms that “record and examine activity” in systems holding electronic protected health information. NIST SP 800-53 Rev. 5 control AU-2 asks organisations to define the event types to log and to give a rationale for why they are adequate “to support after-the-fact investigations”, and AU-12 requires audit record generation for those events. UK GDPR Article 32 requires appropriate security of processing, including regular testing of the measures in place. PCI DSS has logging and monitoring requirements for cardholder data environments; see our PCI DSS page for how we approach them.
A DAM tool helps produce evidence for these controls. Whether a control is met depends on what you audit, how you configure the tool and what your assessor accepts.
How to evaluate a DAM tool
Start with your estate and your requirements, then test the claims. These questions separate products quickly:
- Engine and version coverage. Which engines and versions, and through which mechanism for each?
- Collection architecture. Agent, network, native audit or proxy, and what changes on the database host or connection path?
- Blocking versus alerting. Do you need prevention, or detection with fast response?
- Sensitive data discovery. How does it find PII, PHI and card data, and does any of it leave your network? Our post on AI data discovery for PII and PHI compares the approaches.
- Behaviour analytics. Per-identity baselines, or fixed rules only?
- Evidence integrity. Can exported evidence be verified by an auditor?
- Integrations. Which SIEM and ticketing formats are supported?
Our DAM buyer’s guide turns these into a scoring template and a proof-of-concept plan.
How SWOT DAM approaches database activity monitoring
SWOT DAM uses the native audit trail architecture. Collectors sign in with read-only credentials and read Oracle Unified Audit, PostgreSQL pgAudit, SQL Server Audit, the MySQL and MariaDB server_audit plugin, and CloudWatch log groups for Amazon RDS and Aurora. It has no inline proxy and installs nothing on the database host, so it detects and alerts rather than blocking. According to its documentation, it never connects to user data tables or copies business records.
Each identity gets a risk score from 0 to 100 against its own 30-day baseline. Four alert rules cover unauthorised schema changes, privilege escalation, more than 5 failed logins within 60 seconds, and single queries reading more than 50,000 rows from tables flagged as PII or financial. The Sensitive Data Sentinel classifies new columns every 24 hours from their names and types. Alerts go to Splunk over HEC, QRadar and ArcSight as CEF over syslog, webhooks and email, and the forensic audit log exports signed CSV or PDF with a SHA-256 receipt.
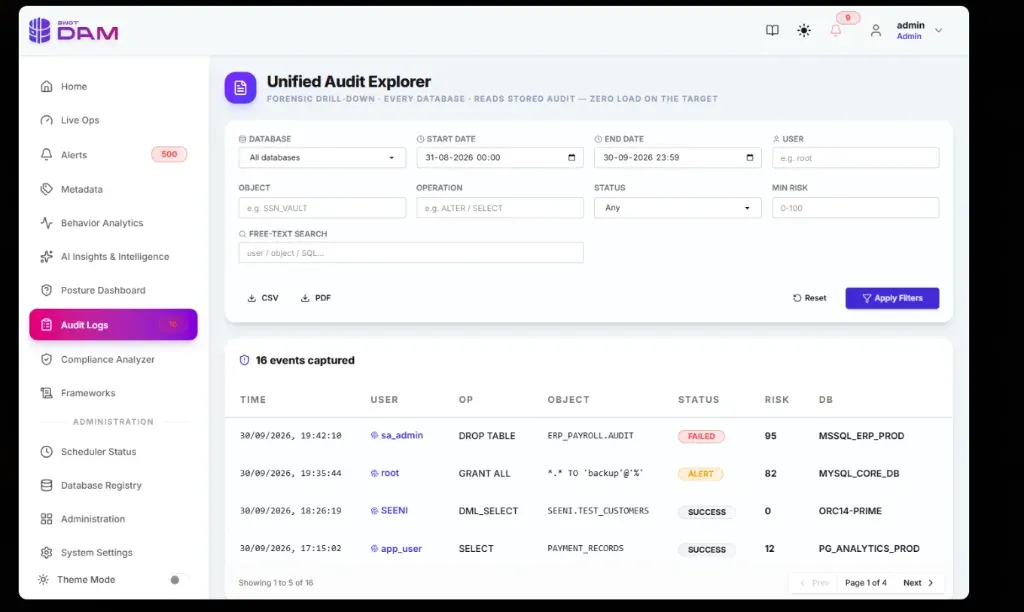 SWOT DAM: the forensic audit log.
Database activity monitoring rollout checklist
- List every database in scope with engine, version, owner and the sensitivity of its data.
- Decide whether you need blocking or detection, and pick the architecture to match.
- Enable and tune native audit on each engine: logons, failed logons, privilege changes, DDL, and DML on sensitive tables.
- Create a dedicated, least-privilege account for the collector on each database.
- Run sensitive data discovery and confirm the results with data owners.
- Let behaviour baselines settle before you route alerts to on-call staff.
- Forward scored alerts to your SIEM and ticketing tools, and agree who triages each rule.
- Define retention, export format and who may read the audit store.
- Test the detections: a failed-login burst, an unapproved GRANT, a DROP outside a change window, a bulk read of a sensitive table.
- Review the evidence export with your auditor before the first assessment.
Next steps
Database activity monitoring records and scores what happens inside your databases, and the collection architecture you choose decides what you can see, what you can block and what changes on your hosts. Start with audit configuration and a sensitive-data inventory, then test detections before you rely on them. To see the native-audit approach on your own engines, book a SWOT DAM demo.
Questions
Does native database auditing replace a DAM tool?
Native auditing generates the records, but it leaves them on the server it describes, in a format specific to each engine, with no alerting or baseline. A DAM tool collects those records from many engines, normalises them, scores them and stores them where database administrators cannot quietly change them.
Can database activity monitoring block a query?
Only when it sits in the connection path. Oracle documents that its Database Firewall can block SQL in proxy mode, but in out-of-band and host monitor modes it can only monitor and alert. Tools that read native audit trails, such as SWOT DAM, detect and alert, then help you respond.
How much audit data should we keep?
Set retention from your regulatory and investigation needs, not from tool defaults. Many teams keep recent events searchable and archive older events in signed exports. Agree the period with your compliance owner and confirm the DAM store has the disk and backup plan to hold it.
Is DAM only for regulated industries?
No. Any organisation whose databases hold customer, financial or employee records benefits from knowing who reads and changes them. Regulated sectors such as banking and healthcare have a clearer legal obligation to produce that evidence for auditors, and often face more detailed questions about privileged database access during assessments.
Sources
- Oracle: Introduction to Auditing (Oracle Database 19c Security Guide)
- pgAudit: PostgreSQL Audit Extension README
- Microsoft Learn: SQL Server Audit (Database Engine)
- Oracle: Database Firewall Deployment (Audit Vault and Database Firewall)
- IBM: Linux-UNIX S-TAP user's guide (Guardium)
- NIST: SP 800-53 Rev. 5, Security and Privacy Controls
- Cornell LII: 45 CFR 164.312, Technical safeguards (HIPAA)
- legislation.gov.uk: UK GDPR Article 32, Security of processing
- Rudratic: SWOT DAM documentation
Products in this post

Keep reading
See it on your own systems
A walk-through of the products with the team that builds them.